Election Cycles Mean More Than Just Choosing a President
September 22, 2016 | John Gilliland, Gilliland Group at Morgan Stanley

When people think about cycles in the stock market, they tend to look at the obvious drivers of stock prices: major forces such as the state of the economy, the level of corporate profits, and conditions in global markets. But did you know that a presidential election itself can be a key pivot point in stock price trends?
Consider the average yearly performance of the stock market in the table below. After accounting for random volatility, average presidential election year performance was slightly below overall average performance.
But look at the other years in the election cycle. The first two years of presidential terms have, on average, lagged significantly. But then, in the third year, the market made up the lost ground and more.
What’s Going On?
Election years tend to have a degree of uncertainty over the future direction of the country, and the market may translate that uncertainly into some reluctance to commit on the part of investors. Then, after the direction is set, it may take some time for policy changes to assert any influence, further depressing investment demand. By the third year, clarity could return and investors could embrace the future.
Stock Market Performance and the Election Cycle1
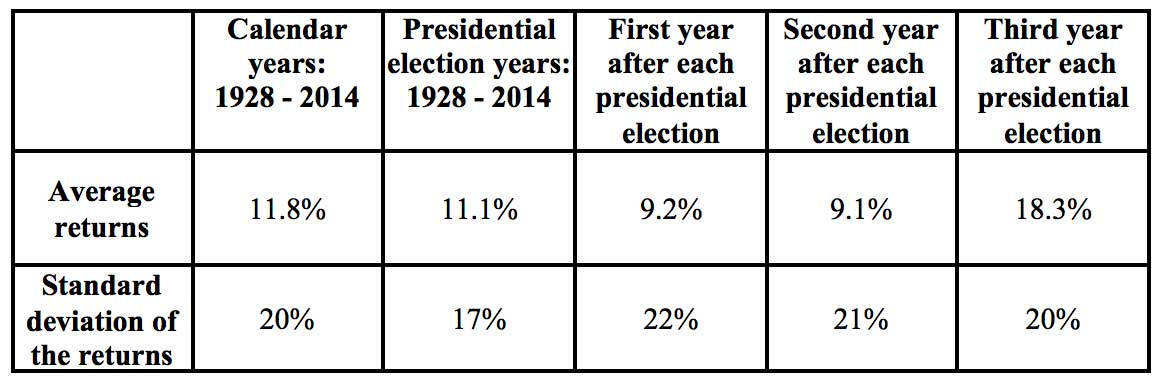
For Illustrative Purposes Only.
Exceptions May Be More Powerful Than the Generalities
Keep in mind that the amount of variation in annual returns is substantial, and is reflected in the high variability, measured by standard deviation. As a consequence, the chances are good that performance in any given year could end up being far different from the average for its category.
That becomes clear when looking at the extremely good and extremely bad performing years in the S&P 500 performance data set. The four best years were 1928 (44%), 1933 (53%), 1935 (60%), and 1954 (52%). The four worst years were 1931 (-41%), 1937 (-34%), 1974 (-26%), and 2008 (-37%).1
No two of the extreme up years occurred at the same point in an election cycle, neither did any two of the extreme down years. Three of the extreme years are associated with Democratic incumbents and five with Republican incumbents.
Ultimately, six of the eight extreme performance years were associated with unpredictable macroeconomic tidal waves--the Great Depression, the oil price shock (when energy prices quadrupled in a few months), and the recent financial crisis --events much bigger than any election news.
So if you are thinking of cashing in on an election year rally--or selling before an election year rout--think again. As history has shown, trying to time the market--for whatever reason--is often a loser’s game. Instead, work with your financial advisor to determine an appropriate long-term asset allocation that suits your goals and needs.
Sources
1Source: Wealth Management Systems Inc., a DST company. Returns based on yearly total return of the S&P 500 for the period from January 1, 1928, to December 31, 2014. The S&P 500 has performance data going back to 1926, including the elections that occurred in 1928 and every four years thereafter. It is an unmanaged index generally considered representative of the US stock market. Investors cannot invest directly in any index. Index returns do not represent the performance of any actual investment and do not reflect the costs and commissions associated with investing. Past performance does not predict future results.
If you’d like to learn more, Please contact John R. Gilliland.
Categories